Section: Mathematics
19)
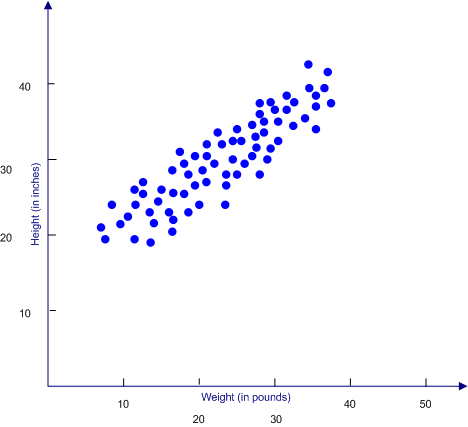
The scatterplot shows the height of a group of children and their weight. Which statement is MOST strongly supported by the scatterplot?
-
-
-
-
-
Explanation
This scatterplot shows a positive correlation. Thus as the data on the x-axis increases, so does that on the y-axis.